Image


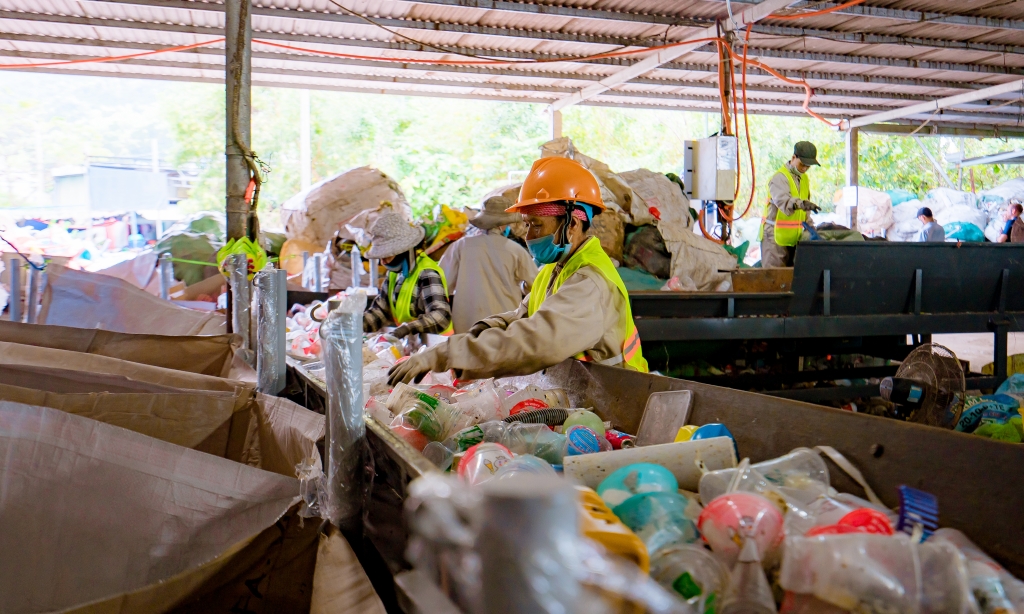
The world faces significant water challenges. There is a finite volume of fresh water that is accessible for human use, and we live in a world that has been steadily growing. The global economy is seven times larger than it was in 1960, and the world population is more than twice as large as in 1960. This growth is fed by water-intensive agriculture, and water resources are increasingly strained. Climate change and recent water crises in California, Australia and Brazil suggest we may need a new path forward for managing water resources.
One natural way to reduce water use is to reduce economic growth. But, in its upcoming annual meetings, the International Monetary Fund will emphasize how growth can ensure higher standards of living for more people. China and India illustrate that growth allows emerging economies’ per capita GDP to catch up to more advanced economies’ living standards. Thus, for both efficiency and social equity reasons, the plea by the Club of Rome of the early 1970s to halt economic growth to protect the environment is likely unconvincing.
A more realistic goal may be to decouple economic growth from water and other natural resource use. Sustained water productivity is key. The idea is to do more with less water, and thus keep water use under its current levels. This is not as far-fetched as it may seem.
The United States is one of a few countries with enough water withdrawal data to analyze long-term water use. The figure below shows U.S. GDP growth and water use since 1950, as multiples of 1950 starting points.
Figure: Assessing U.S. Water Use Since 1950 (1950 values =1)
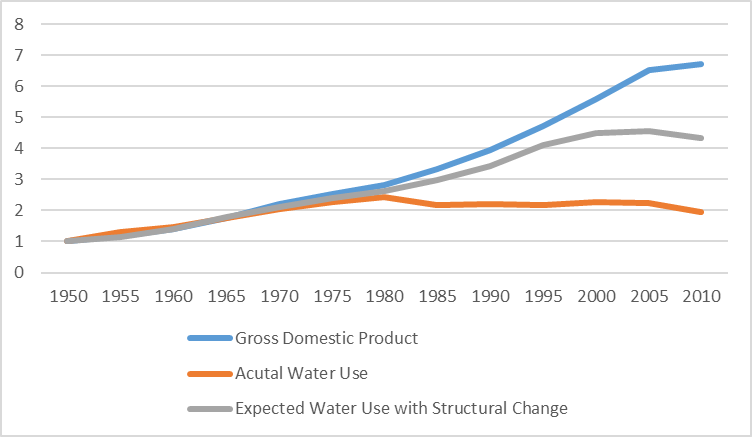
The figure highlights three points.
What might explain these stark gains in water productivity? We often assume that technological change drives changes in productivity. Debaere and Kurzendoerfer[i] show that technological improvements are indeed important. However, they also show that almost half the productivity gains come from the shifting structure of the economy. Over 70 percent of U.S. GDP now comes from the services sector, while GDP shares attributable to agriculture and manufacturing have declined. Services are less water intensive than manufacturing and far less so than agriculture. Every dollar of manufacturing uses three times as much water as a dollar of services. Every dollar of agriculture uses 700 times as much water as a dollar of services.
The middle (gray) line in the figure shows expected U.S. water use over time after accounting for changes in the sectoral structure of the U.S. economy alone, and not counting technological improvement and other factors. The difference between the top (blue) and middle (gray) line, then, illustrates productivity gains due to structural change in the economy alone. The gap between the middle (gray) and lower (blue) line illustrates productivity gains due to other factors like improving technology.
The punchline is that the U.S. case shows that an economy can grow without increasing water use. This is encouraging. Moreover, public policy can accelerate water-saving sectoral shifts and technological upgrades. Proper water pricing has a key role to play. Water is almost universally underpriced or available for free. This supports wasteful behavior and misallocating water in low-value activities. Improper water pricing also holds back investments and innovation in water-saving technology, as the return on investment remains too low.
Nevertheless, the United States and the world likely still use too much water. The Global Water Initiative at UVA studies, among other things, how we can continue to improve water productivity and how we can promote sustainable water use at home and abroad.
This article originally appeared on the Global Water Blog, part of the University of Virginia Global Water Initiative.
[i] Peter Debaere and Amanda Kurzendoerfer, “Decomposing U.S. Water Withdrawal Since 1950,” Journal of the Association of Environmental and Resource Economists (JAERE), March 2017, 155-196.